In the City’s Vital Statistics, so Many Ways to Die by Accident
Al Baker, New York Times (February 15, 2010)Summary of Vital Statistics 2008
Bureau of Vital Statistics, New York City Department of Health and Mental Hygiene (January 2010)
‘Tis the Season for Annual Reports on Mortality Statistics. The City of New York has now released its 2008 numbers for all forms of human death. Good news for Gotham: homicides are down and so are accidental deaths. That said, at least one person is killed a week while walking. Make sure and wait for the crosswalk sign.
Here is an interesting section from the New York Times article at the top on the overall mortality rate changes.
In 2008, of the 54,193 people who died in the city, 1,044 deaths (excluding drug overdoses) were classified by the city’s Department of Health and Mental Hygiene as accidental — an 8.8 percent decline from 1998, when there were 1,145 accidental deaths. In contrast, the number of homicides fell 17.5 percent in that same period. The contrast is more stark going back to 1993: accidental deaths have fallen by 30.1 percent, while homicides have dropped by 73.2 percent…
…There are roughly 6,000 codes used to define deaths by accident, reflecting all types of violence and disorder. People are run over by cars, buses or taxis. There are dozens of codes to define deaths from drug consumption. Some die from the smoke and flames of fires, or they fall at construction sites or in their own backyards. Others are hit by trains, drown at beaches or crash their bicycles.
I understand why Departments of Health compile these statistics because it is useful to know how people are dying in a local area. Lawyers generally like to know these numbers too and a good funeral director can just tell you how people are dying without even looking at the vital statistics. Death by the numbers, as I like to call it, also reminds me of Meg’s recent post on Life Insurance Policies. Mix in bizarre, insane, unbelievable accidents and you basically have the annual Darwin Awards.
But I digress…
If you are a true student of Mortality statistics (and I have some friends who are) then please download the official 2008 report by the New York City Department of Health and Mental Hygiene, Bureau of Vital Statistics.
And if your attention span can’t handle charts, graphs, and brief descriptions of tragedy then please, oh-please, watch these short Public Service Announcements about preventing accidental deaths in the workplace. I am always amazed at what YouTube offers when you really need a solid bit of video:

2 replies on “Dying by the Numbers in New York City”
Holy crap, Canada! Them some PSAs! Interesting article, John — I immediately perked up at the mention of death classification. I’ve seen some fascinating, historical death classifications; it’s really interesting how they evolve over time, based on advances in medicine (both determining the real problem and finding cures), as well as other kinds of causes of deaths, then and now.
This would be a good (librarian-y) area to dig into more… I’ll keep it in mind for a future post.
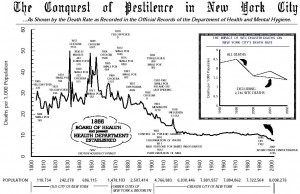
Thanks Meg. If you can look at the graphic in a larger format, you’ll see how the classifications have changed for NYC.